Week 29.2 Kubernates HPA, Node, Autoscale
In this lecture, Harkirat focuses on advanced Kubernetes concepts and practical implementations. He introduces the Horizontal Pod Autoscaler (HPA) and provides a demo app for hands-on practice. The lecture covers scaling techniques in Kubernetes, emphasizing resource requests and limits for efficient pod management. Harkirat then explores cluster autoscaling, demonstrating how to dynamically adjust cluster resources based on workload demands.
Horizontal Pod Autoscaler
Horizontal Pod Autoscaler (HPA) in Kubernetes is an important feature for automatically scaling applications based on observed metrics. Here’s an elaboration on the key points:
- Definition and Purpose:
- HPA automatically adjusts the number of pod replicas in deployments, replica sets, or stateful sets.
- It scales based on observed metrics like CPU utilization or custom metrics.
- The goal is to handle varying loads efficiently by scaling out (adding pods) when demand increases and scaling in (reducing pods) when demand decreases.
- Horizontal Scaling:
- This refers to adding more pods to the cluster, rather than increasing resources of existing pods.
- It’s called “horizontal” because it expands the application laterally (more instances) rather than vertically (more resources per instance).
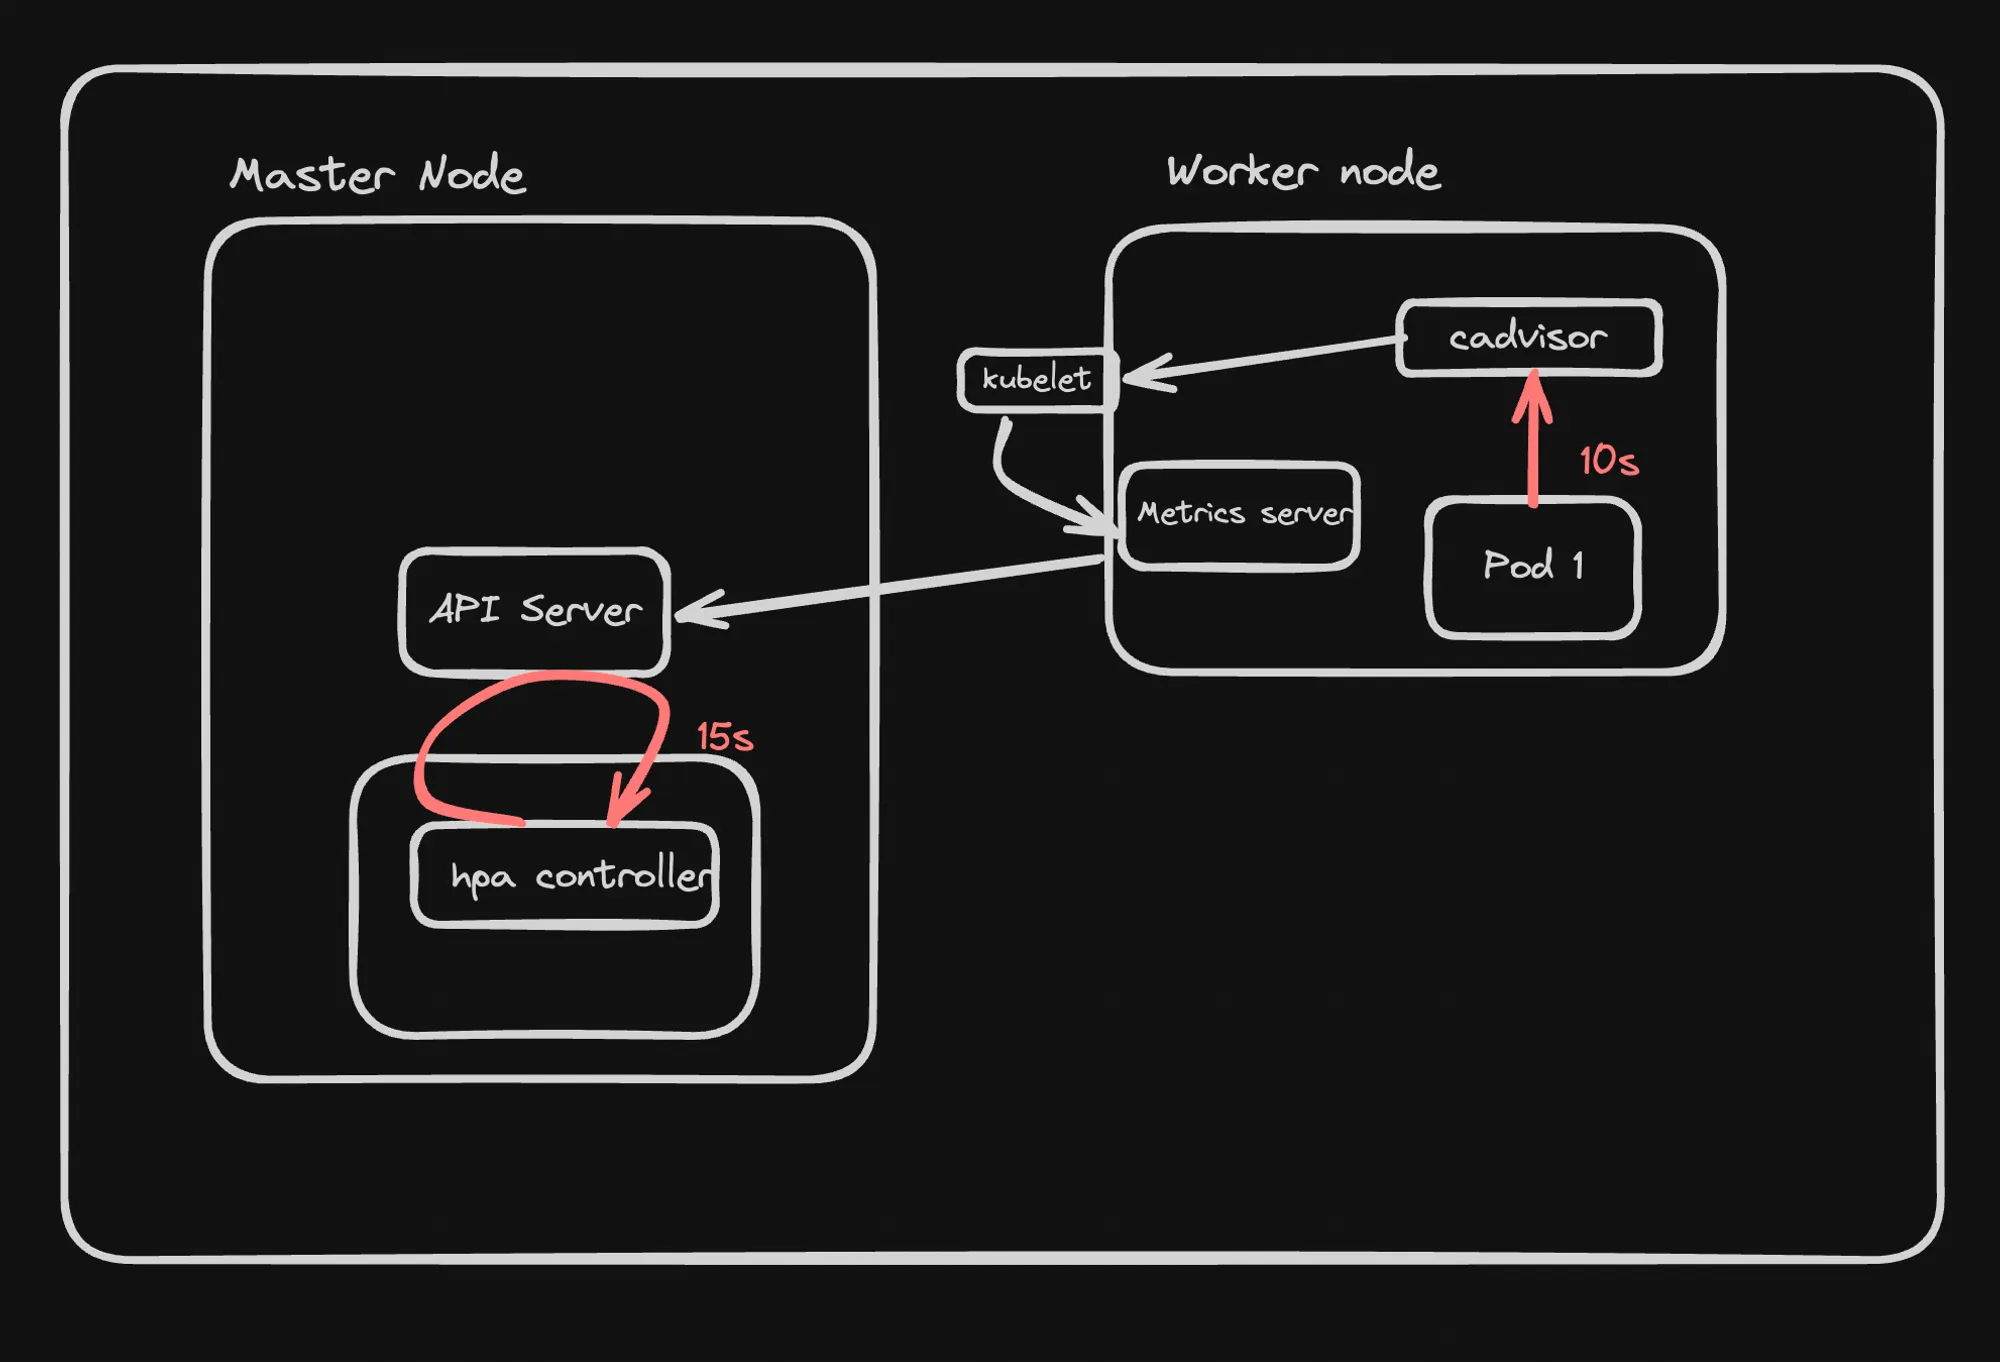
- Architecture:
- HPA operates as a control loop in Kubernetes.
- It runs intermittently, typically every 15 seconds, not continuously.
- Components:
- cAdvisor: A tool for collecting, aggregating, and exporting resource usage data from containers.
- Metrics Server: A lightweight, in-memory metrics storage system that collects resource usage data (CPU, memory) from kubelets and exposes it via the Kubernetes API.
- Installation and Usage:
-
The Metrics Server can be installed using kubectl:
Terminal window kubectl apply -f <https://github.com/kubernetes-sigs/metrics-server/releases/latest/download/components.yaml> -
Metrics can be viewed using commands like:
Terminal window kubectl top pod -n kube-systemkubectl top nodes -n kube-system
-
- HPA Controller Operation:
-
The HPA controller sends requests to the API server to fetch metrics.
-
A sample request might look like:
Terminal window GET https://[cluster-url]/apis/metrics.k8s.io/v1beta1/namespaces/default/pods
-
This setup allows Kubernetes to automatically adjust the number of running pods based on actual resource usage or custom metrics, ensuring efficient resource utilization and application performance under varying loads.
Demo App
This section introduces a sample application that will be used to demonstrate Horizontal Pod Autoscaling (HPA) in Kubernetes. Here’s a breakdown of the key points:
-
Purpose:
- The application is designed to perform a CPU-intensive task, which will help in observing horizontal scaling in action.
-
Application Details:
- It’s a simple Express.js application.
- The main route (’/’) performs a computationally intensive operation.
-
Code Overview:
import express from 'express';const app = express();const BIG_VALUE = 10000000000;app.get('/', (req, res) => {let ctr = 0;for (let i = 0; i < BIG_VALUE; i++) {ctr += 1;}res.send('Hello World!');});app.listen(3000, () => {console.log('Server is running on port 3000');}); -
Key Features:
- The application runs a large loop (10 billion iterations) on each request to the root path.
- This loop is designed to consume significant CPU resources.
- After completing the loop, it sends a simple “Hello World!” response.
-
Deployment:
- The application has been containerized and is available as a Docker image.
- The image is hosted on Docker Hub at: https://hub.docker.com/r/100xdevs/week-28
-
Relevance to HPA:
- This app is ideal for demonstrating HPA because:
- It has a predictable and controllable CPU load.
- The load can be easily triggered by making HTTP requests.
- It allows observation of how Kubernetes scales the number of pods in response to increased CPU usage.
- This app is ideal for demonstrating HPA because:
-
Expected Behavior:
- Under low load, the application should run in a minimal number of pods.
- As more requests are made, CPU usage will increase.
- This increase should trigger HPA to create more pods to handle the load.
- When the load decreases, HPA should reduce the number of pods.
Creating Manifests for K8s Deployment with HPA
1. Deployment with Hardcoded Replicas
First, we create a basic Deployment manifest:
apiVersion: apps/v1kind: Deploymentmetadata: name: cpu-deploymentspec: replicas: 2 selector: matchLabels: app: cpu-app template: metadata: labels: app: cpu-app spec: containers: - name: cpu-app image: 100xdevs/week-28:latest ports: - containerPort: 3000Explanation:
- This Deployment is named “cpu-deployment”.
- It specifies 2 replicas, meaning 2 pods will be created initially.
- The selector and labels ensure that this Deployment manages the correct pods.
- It uses the Docker image “100xdevs/week-28:latest”, which contains our CPU-intensive app.
- The container exposes port 3000.
2. Creating a Service
Next, we define a Service to expose our application:
apiVersion: v1kind: Servicemetadata: name: cpu-servicespec: selector: app: cpu-app ports: - protocol: TCP port: 80 targetPort: 3000 type: LoadBalancerExplanation:
- This Service is named “cpu-service”.
- It selects pods with the label “app: cpu-app”, matching our Deployment.
- It exposes port 80 externally and routes traffic to port 3000 on the pods.
- The LoadBalancer type makes it accessible from outside the cluster.
3. Adding Horizontal Pod Autoscaler (HPA)
Finally, we add an HPA to automatically scale our Deployment:
apiVersion: autoscaling/v2kind: HorizontalPodAutoscalermetadata: name: cpu-hpaspec: scaleTargetRef: apiVersion: apps/v1 kind: Deployment name: cpu-deployment minReplicas: 2 maxReplicas: 5 metrics: - type: Resource resource: name: cpu target: type: Utilization averageUtilization: 50Explanation:
- This HPA is named “cpu-hpa”.
- It targets our “cpu-deployment” Deployment.
- It will maintain between 2 and 5 replicas.
- It scales based on CPU utilization, aiming to keep it at 50% average across all pods.
Applying the Manifests
To apply these configurations:
kubectl apply -f service.ymlkubectl apply -f deployment.ymlkubectl apply -f hpa.ymlThese commands apply our Service, Deployment, and HPA configurations to the Kubernetes cluster.
Additional Notes on HPA Behavior
The note at the end provides important insights into HPA behavior:
- Multiple Metrics: HPAs can use multiple metrics for scaling decisions.
- Scaling Up: If any single metric exceeds its threshold, the HPA will trigger a scale-up event.
- Scaling Down: The HPA will only scale down when all metrics are below their respective thresholds.
This behavior ensures that the system responds quickly to increased load (by scaling up when any metric indicates high utilization) while being conservative about scaling down (only when all metrics indicate low utilization).
In practice, this means:
- Your application can quickly adapt to sudden spikes in different types of resource usage.
- It avoids premature scaling down, which could lead to performance issues if load increases again shortly after.
This setup provides a robust, auto-scaling deployment that can efficiently handle varying loads while optimizing resource usage in your Kubernetes cluster.
Scaling Up
This section focuses on scaling up the Kubernetes deployment using Horizontal Pod Autoscaler (HPA) and load testing. Let’s break down the key points and explain the code snippets:
- Updating Deployment with Resource Limits:
apiVersion: apps/v1kind: Deploymentmetadata: name: cpu-deploymentspec: replicas: 2 selector: matchLabels: app: cpu-app template: metadata: labels: app: cpu-app spec: containers: - name: cpu-app image: 100xdevs/week-28:latest ports: - containerPort: 3000 resources: requests: cpu: "100m" limits: cpu: "1000m"This updated deployment manifest adds resource requests and limits:
- CPU request: 100 millicores (0.1 CPU core)
- CPU limit: 1000 millicores (1 CPU core)
These resource specifications help avoid the error mentioned in the GitHub issue (https://github.com/kubernetes-sigs/metrics-server/issues/237) and ensure proper metric collection.
- Load Testing:
npm i -g loadtestloadtest -c 10 --rps 200 <http://65.20.89.70>This command installs the ‘loadtest’ tool globally and then runs a load test on the specified IP address:
c 10: 10 concurrent connections-rps 200: 200 requests per second
- Monitoring:
After initiating the load test, you can monitor the deployment’s behavior:
kubectl top podsThis command shows CPU and memory usage of pods.
kubectl get hpaThis displays the HPA status, including current and target CPU utilization.
kubectl get podsThis lists all pods, allowing you to observe the scaling behavior.
Key Points:
- Resource limits are crucial for proper HPA functioning.
- Load testing helps simulate real-world traffic scenarios.
- Monitoring commands allow you to observe how Kubernetes responds to increased load.
- You should see the number of pods increase as the CPU utilization rises above the HPA threshold.
This process demonstrates how Kubernetes automatically scales the deployment in response to increased CPU load, showcasing the power of HPA in maintaining application performance under varying traffic conditions.
Formula for Scaling Up
New Desired Capacity = Total CPU Utilization / Target CPU Utilization
This formula is crucial for understanding how HPA determines the number of replicas needed. Let’s break it down:
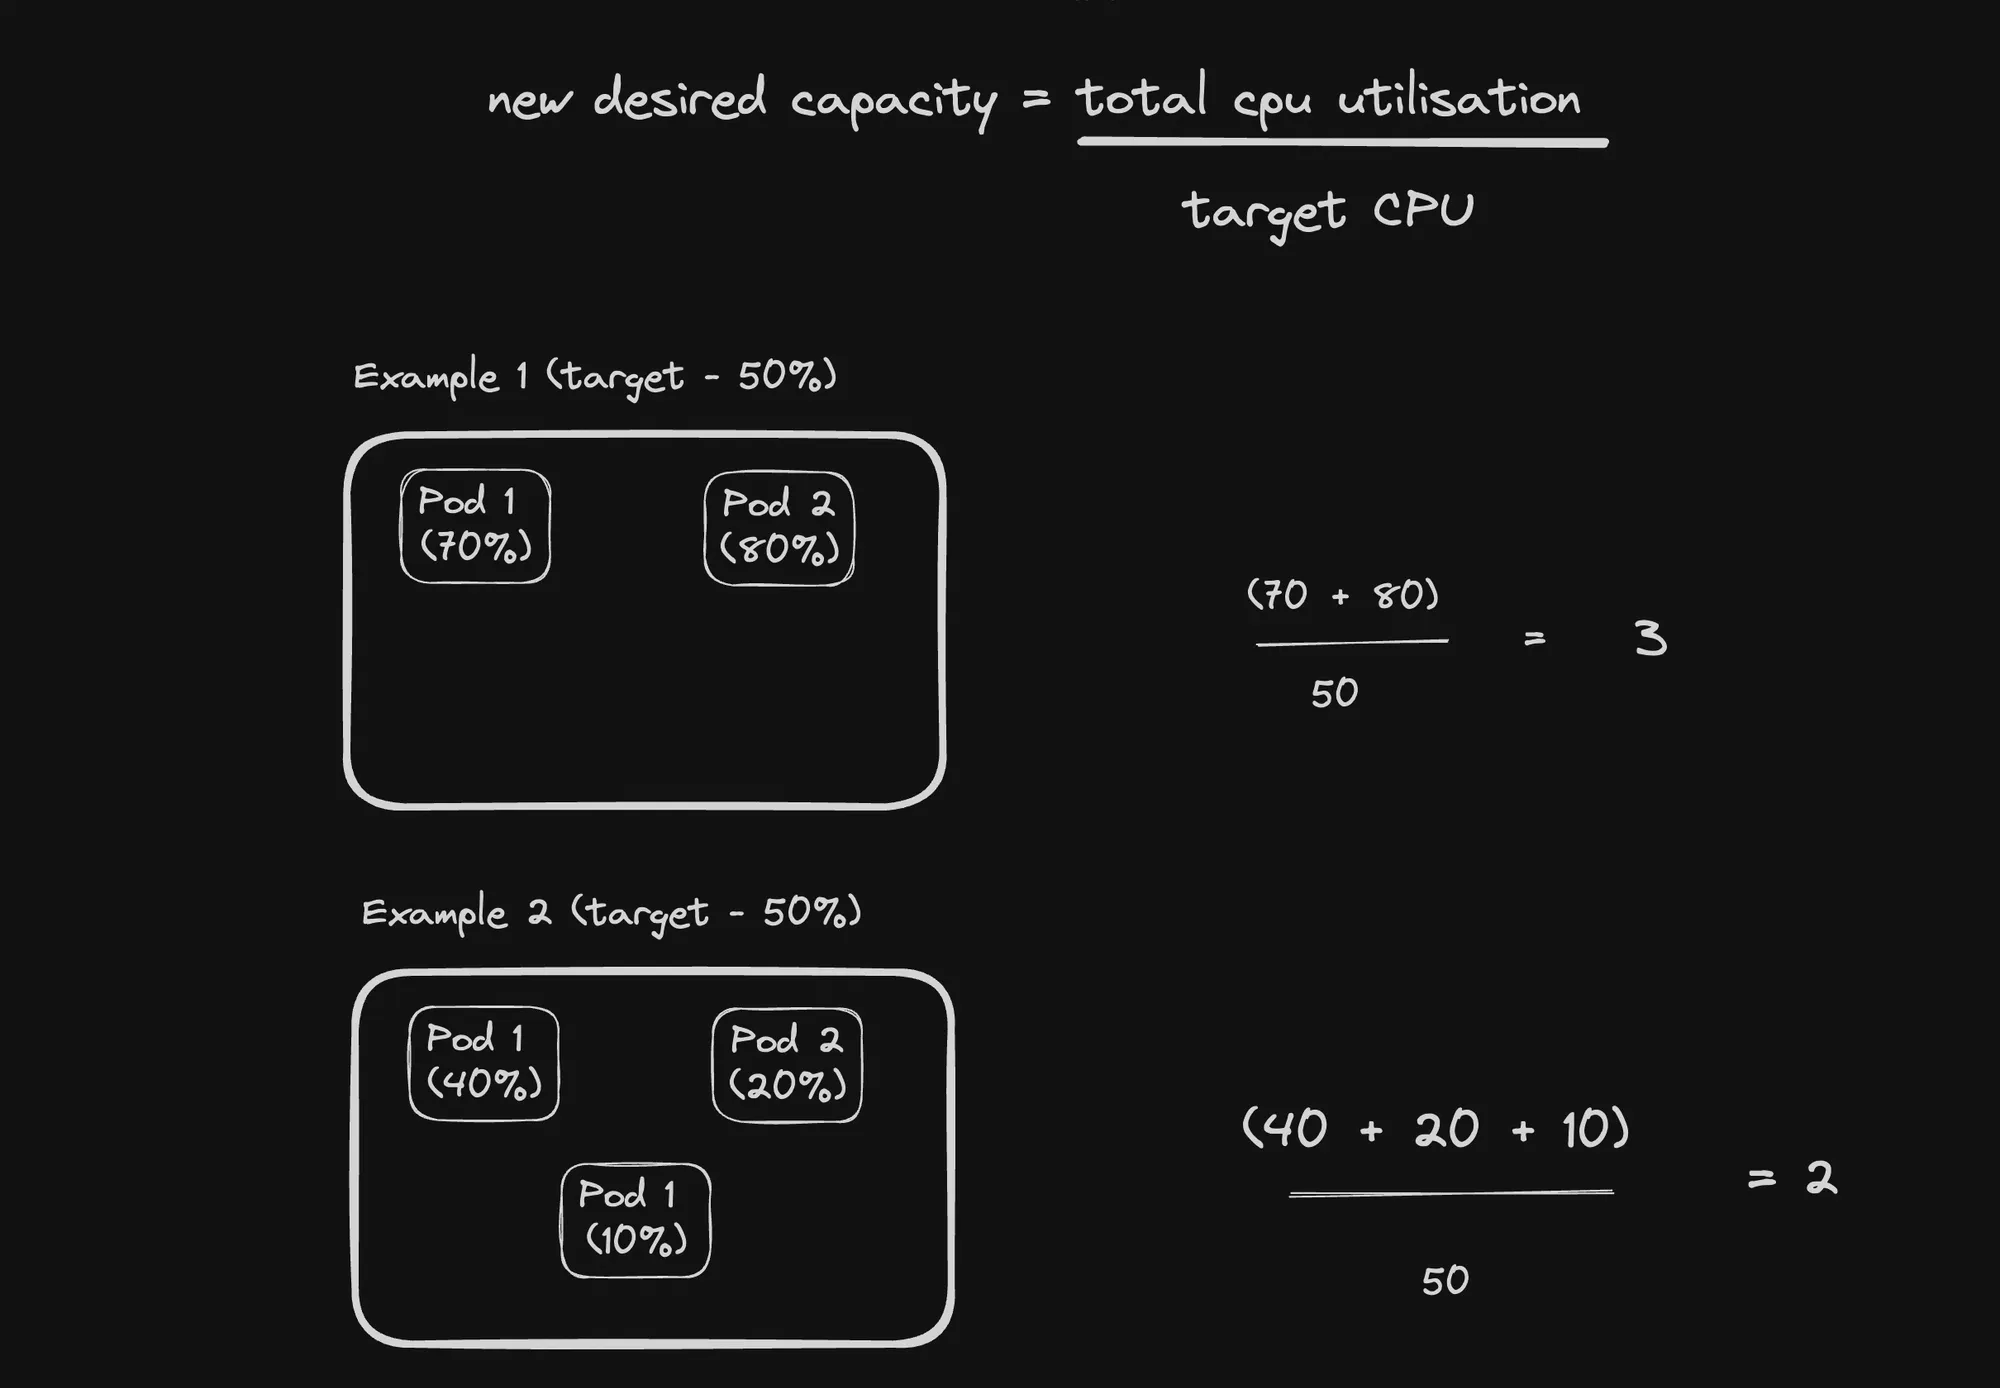
- Total CPU Utilization:
- This is the sum of CPU usage across all current pods in the deployment.
- Measured in CPU units (cores or millicores).
- Target CPU Utilization:
- This is the desired average CPU utilization set in the HPA configuration.
- Usually expressed as a percentage of the requested CPU.
- New Desired Capacity:
- The result of this calculation, rounded up to the nearest integer.
- Represents the number of replicas HPA aims to achieve.
Resource Requests & Limits
This section discusses resource requests and limits in Kubernetes, focusing on CPU and memory management. Let’s break down the key points and explain the code snippets:
- Resource Requests and Limits:
- Resource requests: The minimum amount of resources guaranteed to a container.
- Resource limits: The maximum amount of resources a container can use.
- Difference between limits and requests:
- Containers can use more than their request if resources are available.
- Containers cannot exceed their resource limits.
- Experiment 1: 30% CPU usage on a single-threaded Node.js app
apiVersion: apps/v1kind: Deploymentmetadata: name: cpu-deploymentspec: replicas: 2 selector: matchLabels: app: cpu-app template: metadata: labels: app: cpu-app spec: containers: - name: cpu-app image: 100xdevs/week-28:latest ports: - containerPort: 3000 resources: requests: cpu: "100m" limits: cpu: "300m"This deployment:
- Creates 2 replicas of the app
- Requests 100 millicores (0.1 CPU) per container
- Limits CPU usage to 300 millicores (0.3 CPU) per container
Even though Node.js can use up to 100% CPU, this limit restricts it to 30% CPU usage.
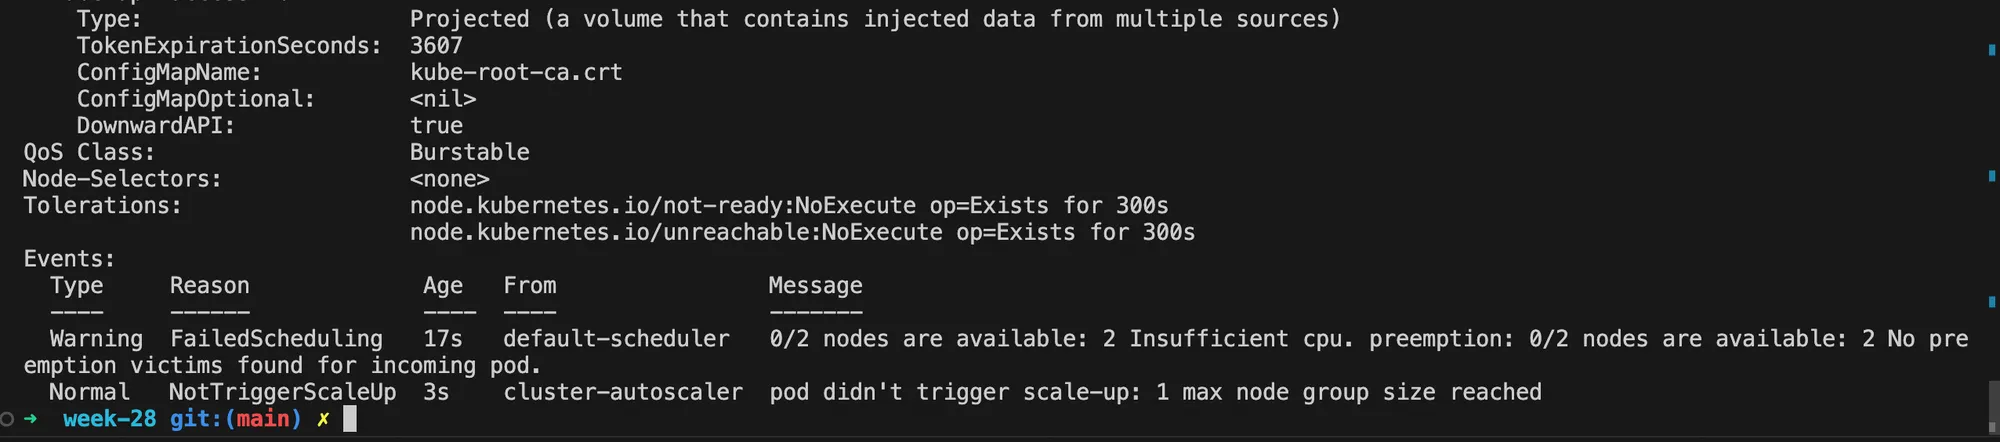
- Experiment 2: Requesting more resources than available
apiVersion: apps/v1kind: Deploymentmetadata: name: cpu-deploymentspec: replicas: 10 selector: matchLabels: app: cpu-app template: metadata: labels: app: cpu-app spec: containers: - name: cpu-app image: 100xdevs/week-28:latest ports: - containerPort: 3000 resources: requests: cpu: "1000m" limits: cpu: "1000m"This deployment:
- Attempts to create 10 replicas
- Each container requests and is limited to 1000 millicores (1 CPU)
This configuration requests more CPU resources (10 CPUs total) than might be available in the cluster. As a result, some pods may remain in a pending state if the cluster doesn’t have enough resources to schedule all of them.
Key takeaways:
- Resource requests ensure a minimum allocation of resources.
- Resource limits prevent containers from using excessive resources.
- Setting appropriate requests and limits is crucial for efficient cluster resource utilization.
- Overcommitting resources (requesting more than available) can lead to scheduling issues.
These experiments demonstrate how Kubernetes manages and enforces resource allocation, which is crucial for maintaining stability and performance in a cluster environment.
Cluster Autoscaling
Cluster Autoscaler is a Kubernetes component that automatically adjusts the size of a Kubernetes cluster based on resource demands. It ensures that:
- All pods have sufficient resources to run.
- There are no unnecessary nodes in the cluster.
Key points:
- Supports multiple cloud providers
- Version 1.0 (GA) was released with Kubernetes 1.8
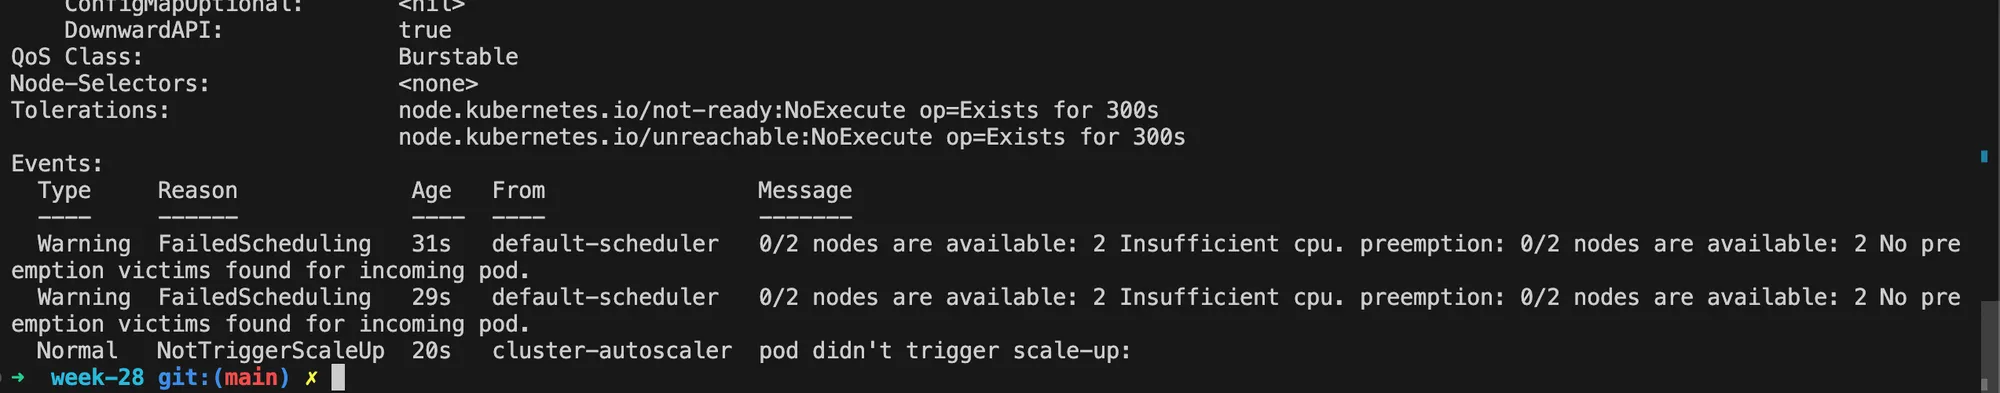
Underprovisioned Resources Scenario
In the previous example, we encountered a situation where there weren’t enough resources to schedule all pods:
apiVersion: apps/v1kind: Deploymentmetadata: name: cpu-deploymentspec: replicas: 10 selector: matchLabels: app: cpu-app template: metadata: labels: app: cpu-app spec: containers: - name: cpu-app image: 100xdevs/week-28:latest ports: - containerPort: 3000 resources: requests: cpu: "1000m" limits: cpu: "1000m"This deployment requests 1 CPU core for each of the 10 replicas, which may exceed the cluster’s capacity.
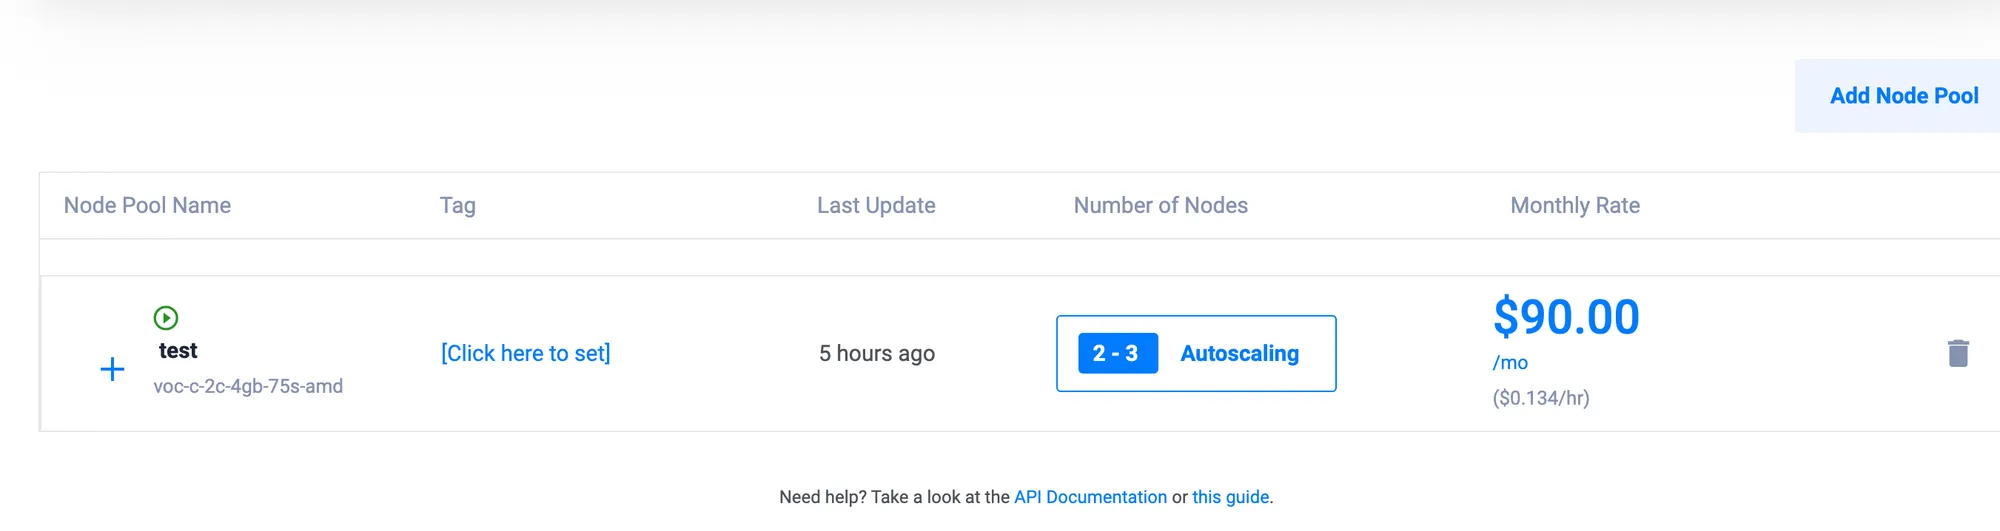
Dynamic Node Pool Configuration
To address this, we can configure the node pool to be dynamic with minimum and maximum node counts. This allows the cluster to scale up when more resources are needed.
Restarting the Deployment
After configuring the dynamic node pool:
kubectl delete deployment cpu-deploymentkubectl apply -f deployment.ymlThese commands remove the old deployment and apply the new one. The Cluster Autoscaler should then add a new node to accommodate the resource demands.
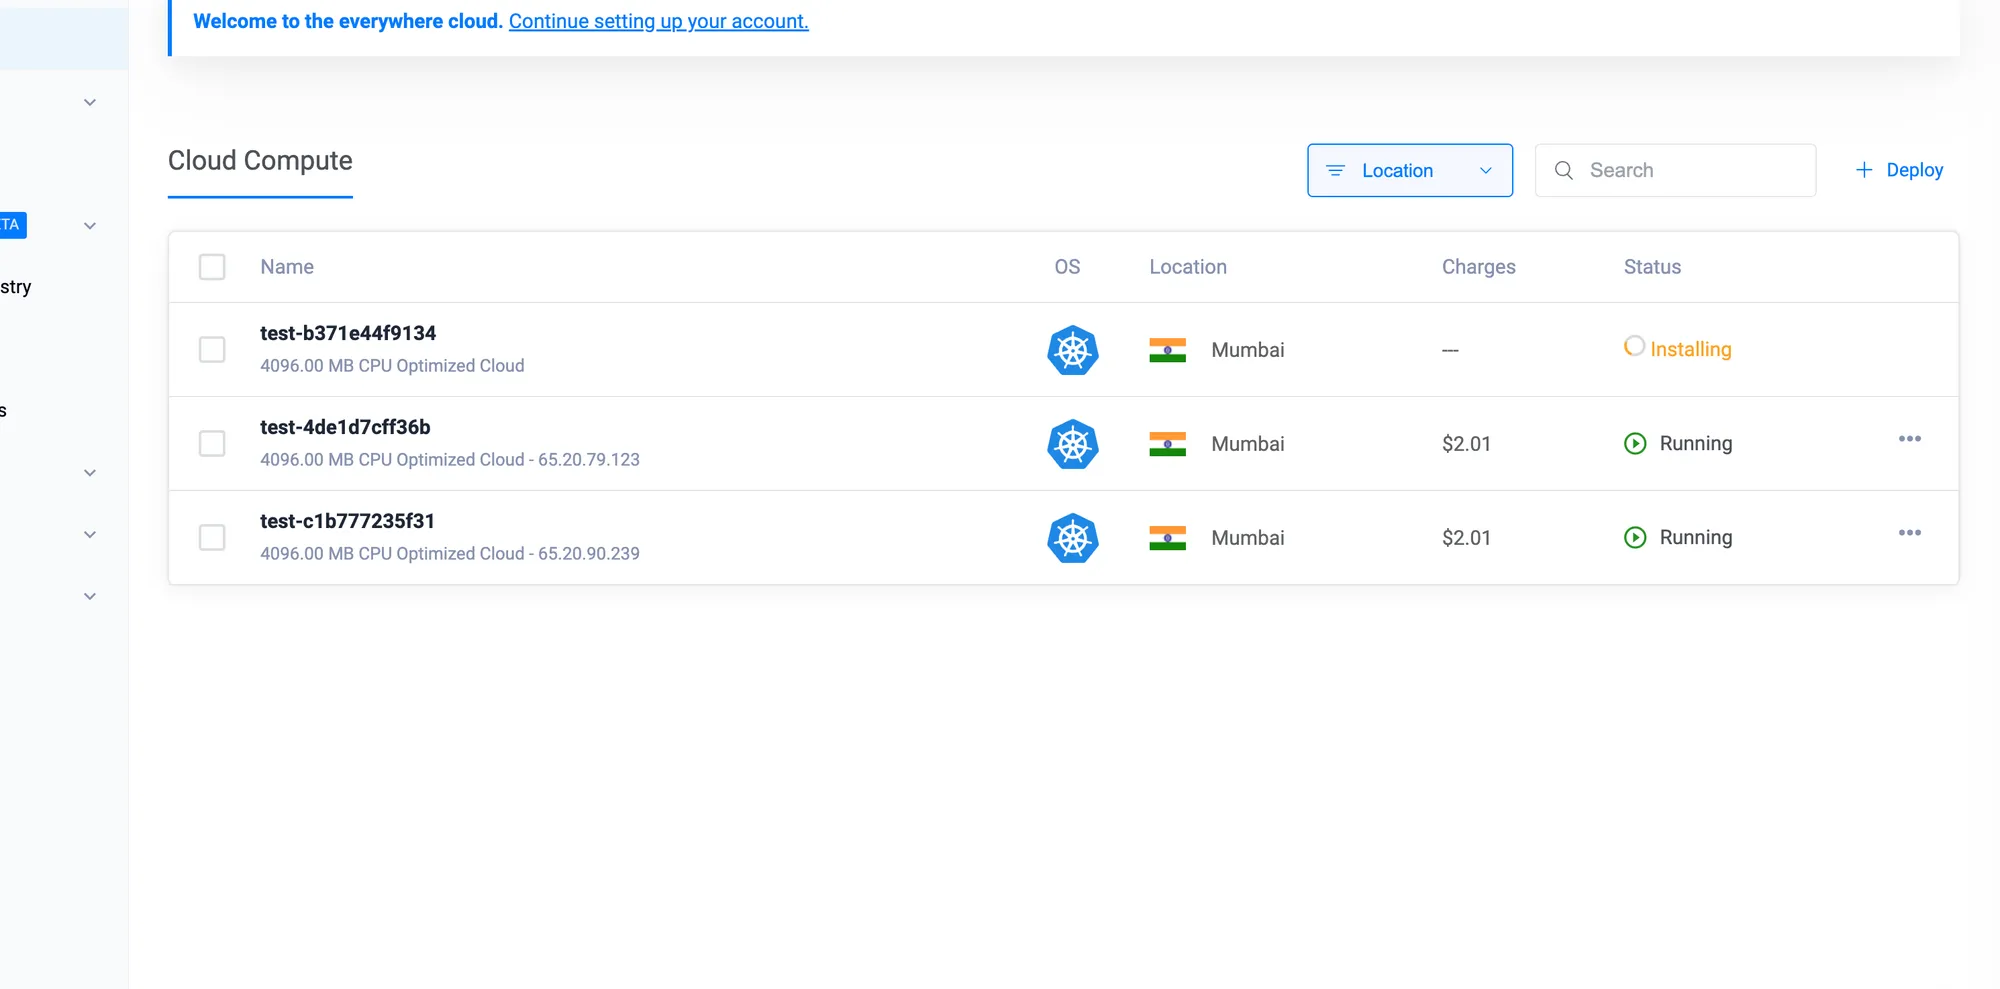
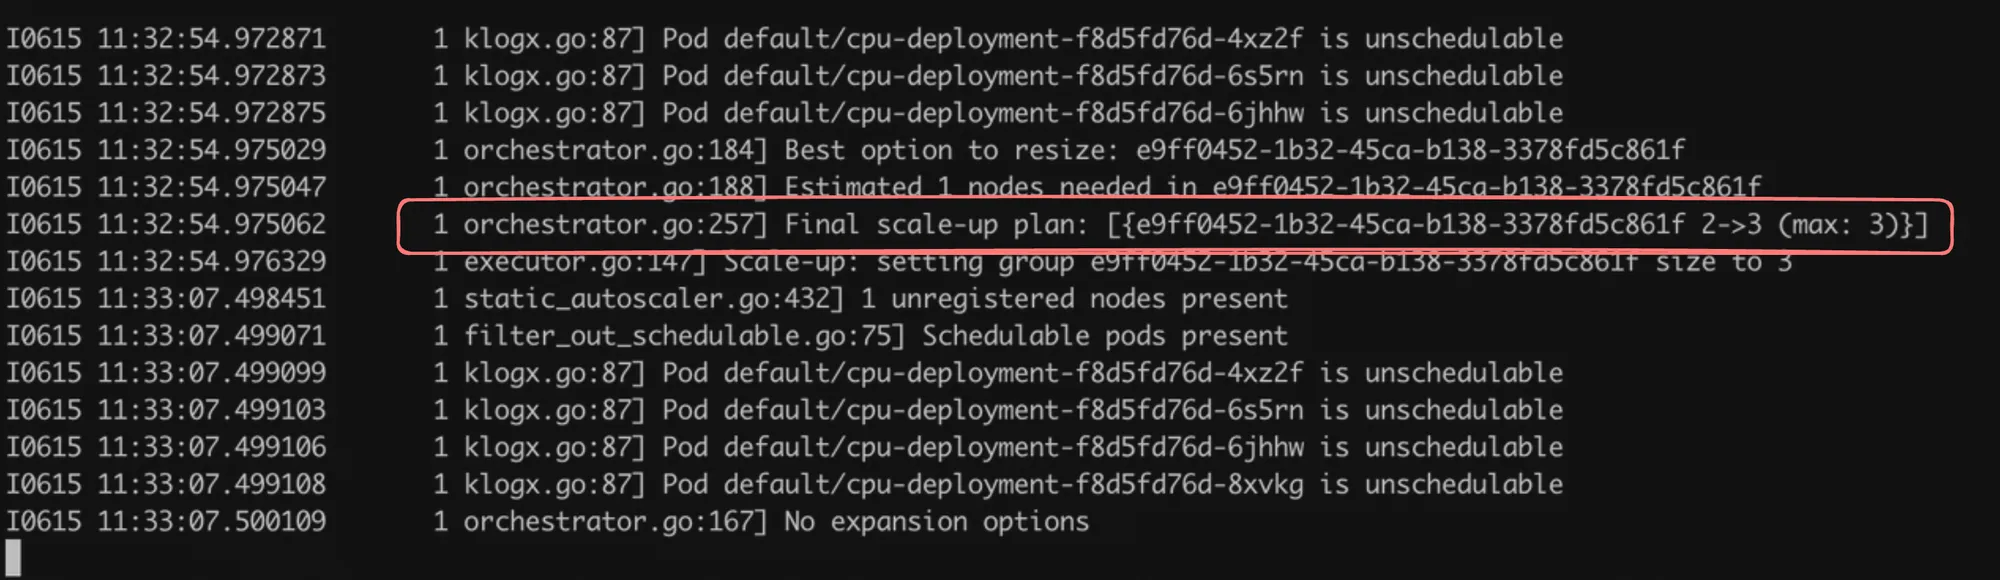
Monitoring Cluster Autoscaler
To check the Cluster Autoscaler pods:
kubectl get pods -n kube-system | grep cluster-autoscalerThis command shows the status of the Cluster Autoscaler pods in the kube-system namespace.
Downscaling Example
apiVersion: apps/v1kind: Deploymentmetadata: name: cpu-deploymentspec: replicas: 10 selector: matchLabels: app: cpu-app template: metadata: labels: app: cpu-app spec: containers: - name: cpu-app image: 100xdevs/week-28:latest ports: - containerPort: 3000 resources: limits: cpu: "1000m" requests: cpu: "1000m"This deployment maintains 10 replicas, each requesting 1 CPU core. When applied, it may cause the cluster to scale up. If you later reduce the number of replicas or resource requests, the Cluster Autoscaler will eventually scale down the number of nodes.
Further Learning Suggestions
- GitOps (ArgoCD): An approach to continuous delivery that uses Git repositories as the source of truth for defining the desired application state.
- Custom Metrics Based Scaling: Scaling based on application-specific metrics rather than just CPU or memory.
- Event-Based Autoscaling: Scaling in response to specific events or patterns in your application.
- Prometheus Integration: Deploying Prometheus in a Kubernetes cluster for advanced monitoring and using its metrics for custom scaling decisions.
These advanced topics build upon the foundational knowledge of Kubernetes autoscaling, allowing for more sophisticated and application-specific scaling strategies.
Kubernetes Lab
This Kubernetes lab is designed to provide hands-on experience with various Kubernetes concepts and practices. Base Repository: https://github.com/code100x/algorithmic-arena/
Let’s break down the tasks and their significance:
- Persistent Volumes (PV) and Persistent Volume Claims (PVC):
- For PostgreSQL database and Redis
- This teaches how to manage persistent storage in Kubernetes
- Deployments:
- For Redis, PostgreSQL, Next.js app, judge API server, and judge workers
- Demonstrates how to deploy different components of a complex application
- Services:
- ClusterIP services for Redis and PostgreSQL (internal communication)
- LoadBalancer service for the Next.js app (external access)
- Shows different service types and their use cases
- Resource Management:
- Adding resource limits and requests to judge workers
- Teaches how to manage and allocate resources in a cluster
- Horizontal Pod Autoscaler (HPA):
- Scaling based on Redis queue length
- Explores advanced autoscaling scenarios beyond CPU/memory metrics
- Custom Metrics:
- Options to expose custom metrics for scaling
- Introduces concepts of custom metrics and how to use them for autoscaling
- Prometheus Integration:
- Using Prometheus for metrics collection
- Shows how to integrate monitoring solutions with Kubernetes
- KEDA (Kubernetes Event-driven Autoscaling):
- An alternative method for queue-based scaling
- Introduces an advanced autoscaling tool
This lab covers a wide range of Kubernetes concepts, from basic deployments and services to advanced topics like custom metrics and event-driven autoscaling. It’s designed to give practical experience with a real-world-like application setup in Kubernetes.