Week 22.1 Vertical Scaling
In this lecture, Harkirat explores vertical and horizontal scaling, single-threaded and multi-threaded architectures, implementing horizontal scaling in Node.js, and capacity estimation using examples. He covers scaling techniques, concurrency models, practical Node.js scaling implementations, and resource estimation based on traffic and performance needs.
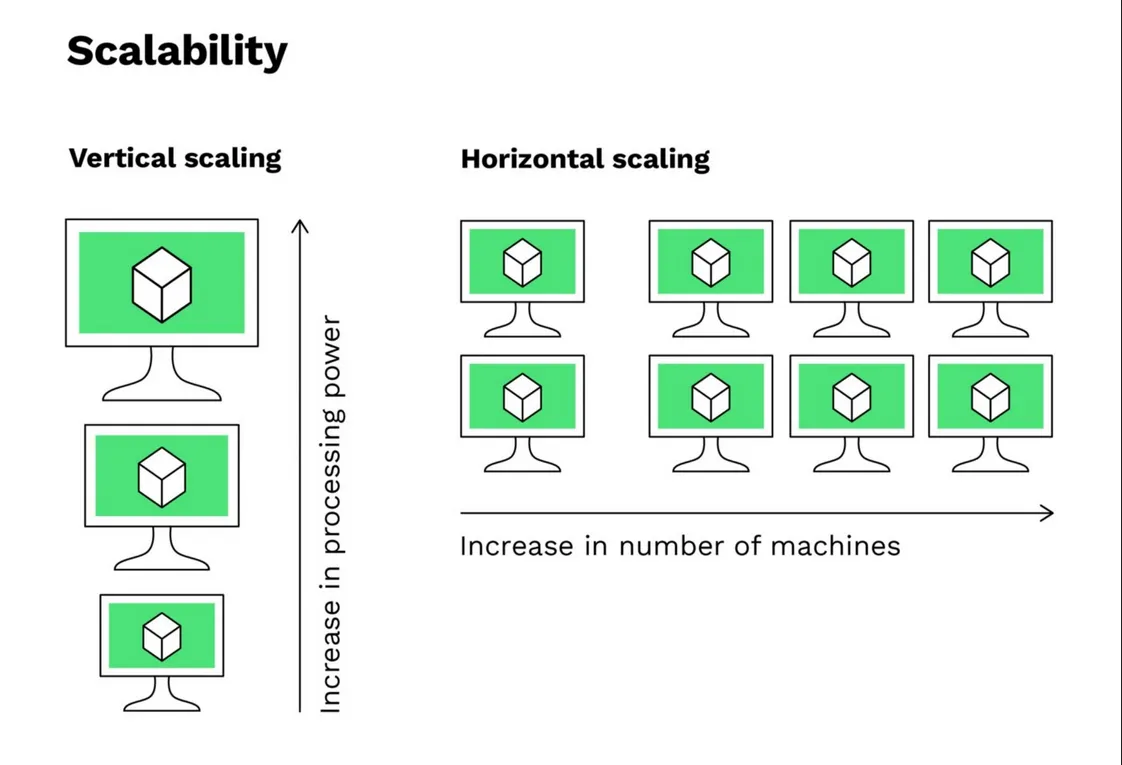
Vertical Scaling
Vertical scaling, also known as scaling up, refers to increasing the capacity of a single machine or instance to handle more load or workload. This typically involves upgrading the hardware resources, such as CPU, RAM, or storage, of an existing server or virtual machine.
Single-threaded Languages
Single-threaded languages, like JavaScript, execute code in a single sequence or thread of execution. This means that at any given time, only one task or operation can be processed. While this simplifies the programming model and avoids potential issues like race conditions and deadlocks, it can limit the ability to fully utilize multiple CPU cores for parallel processing.
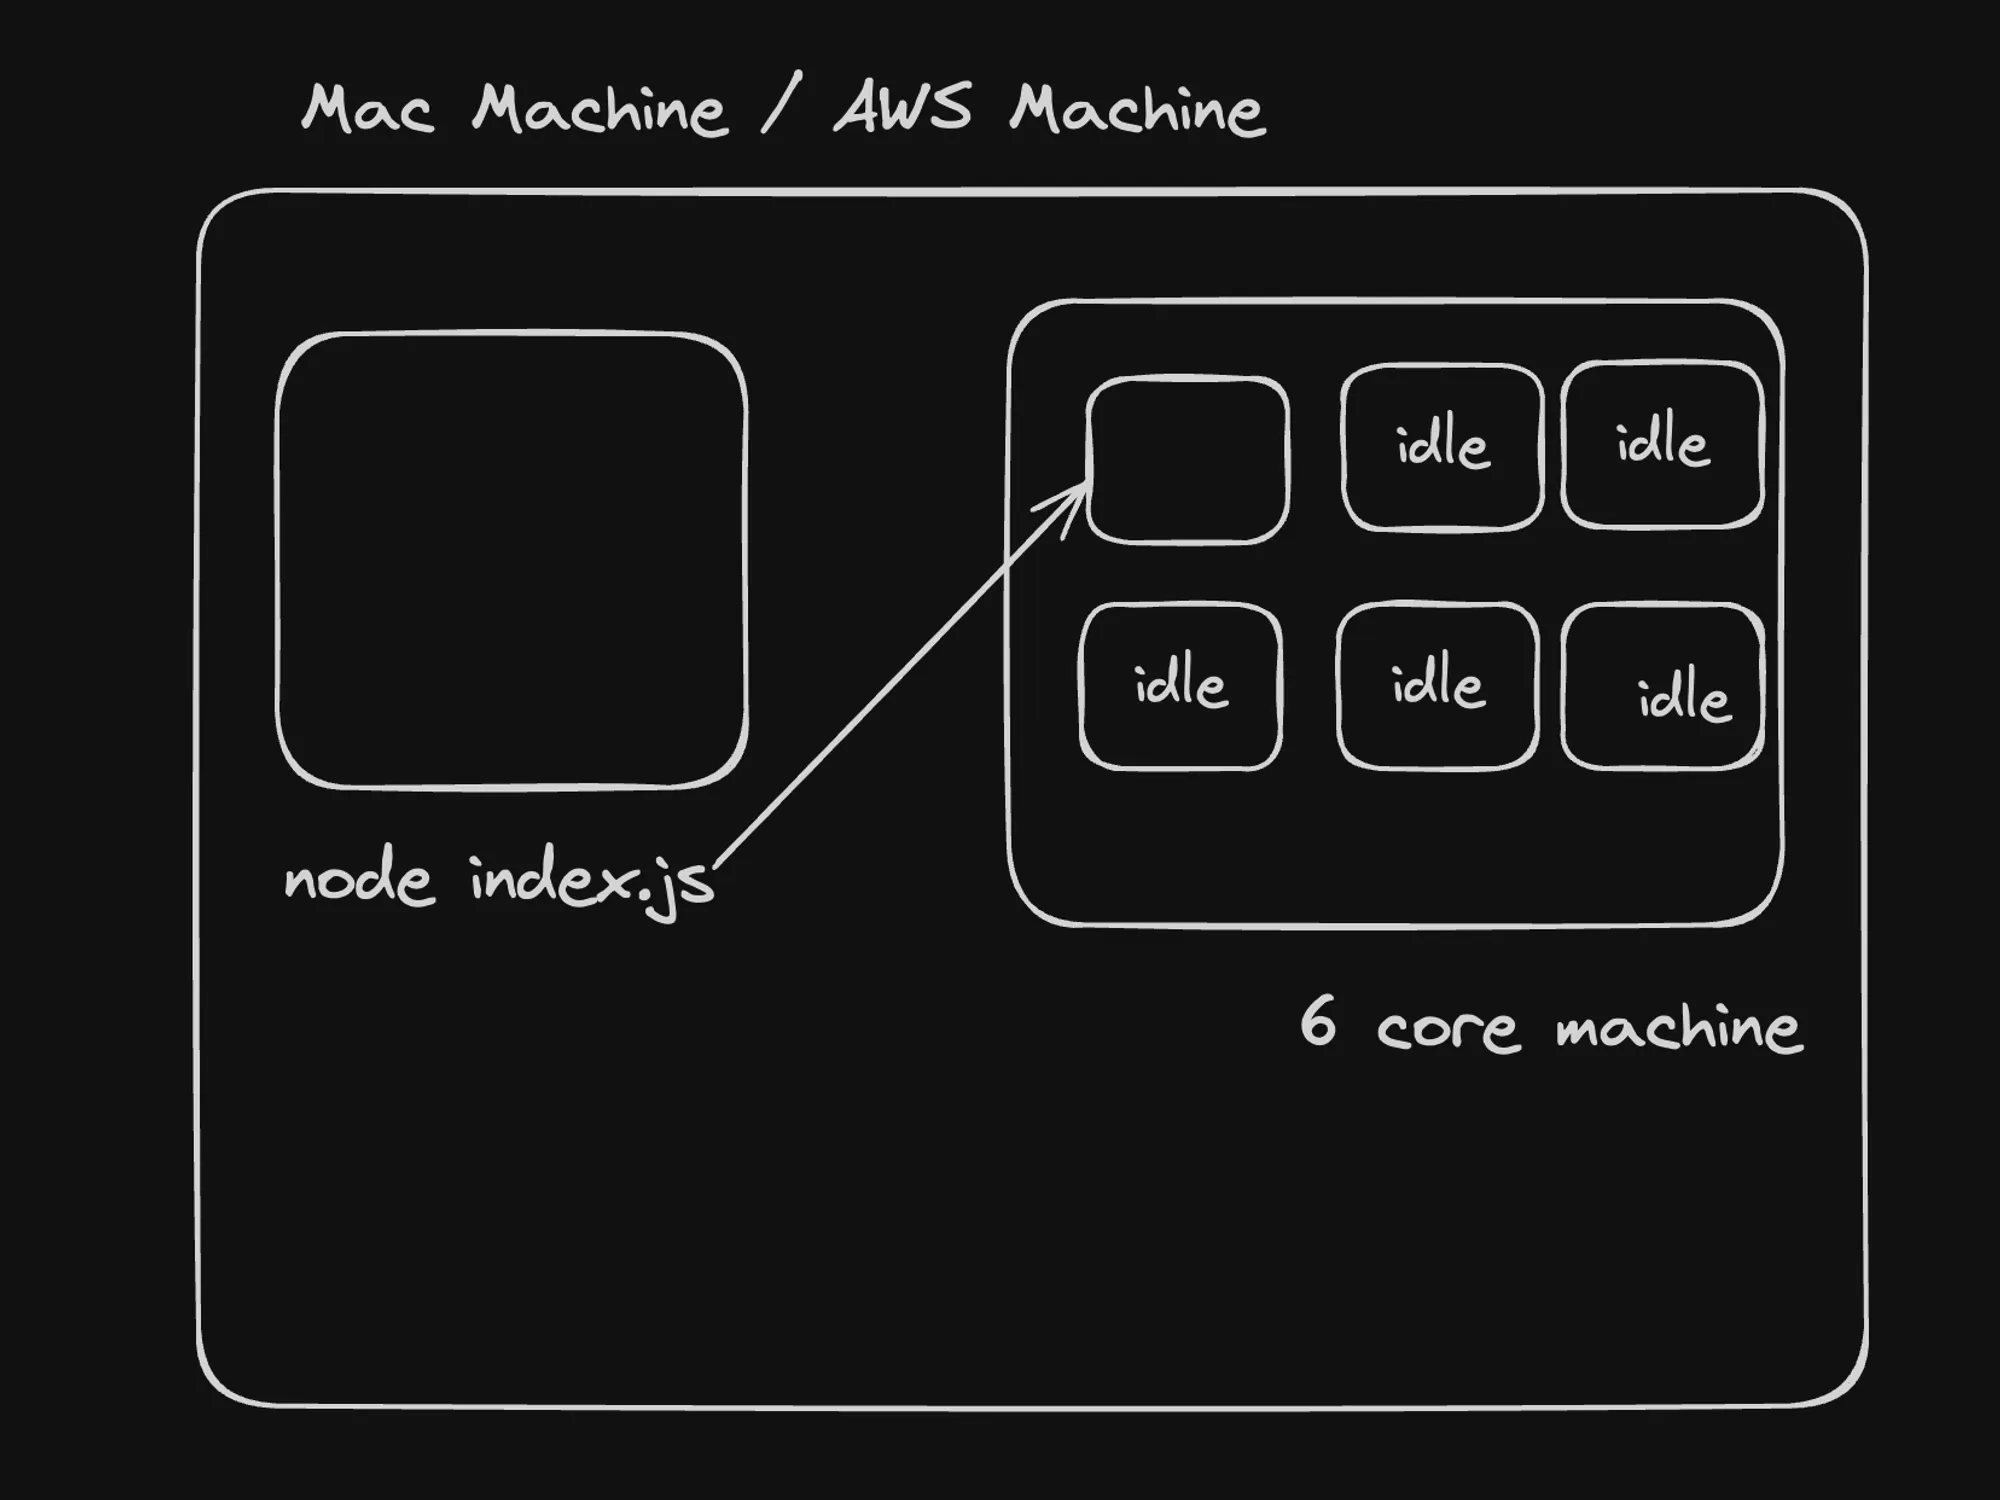
In the case of JavaScript, the language itself is single-threaded, but the runtime environment (e.g., Node.js) can leverage additional threads for specific tasks, such as I/O operations or computationally intensive tasks offloaded to worker threads.
Here’s an example of an infinite loop in JavaScript that demonstrates how it utilizes a single CPU core:
let c = 0;while (1) { c++;}This code will continuously increment the c variable, effectively creating an infinite loop that consumes a single CPU core at 100% utilization.
Multi-threaded Languages
Multi-threaded languages, like Rust, can create and manage multiple threads of execution concurrently. This allows them to take advantage of multiple CPU cores and potentially achieve better performance for certain types of workloads, especially those that can be parallelized.
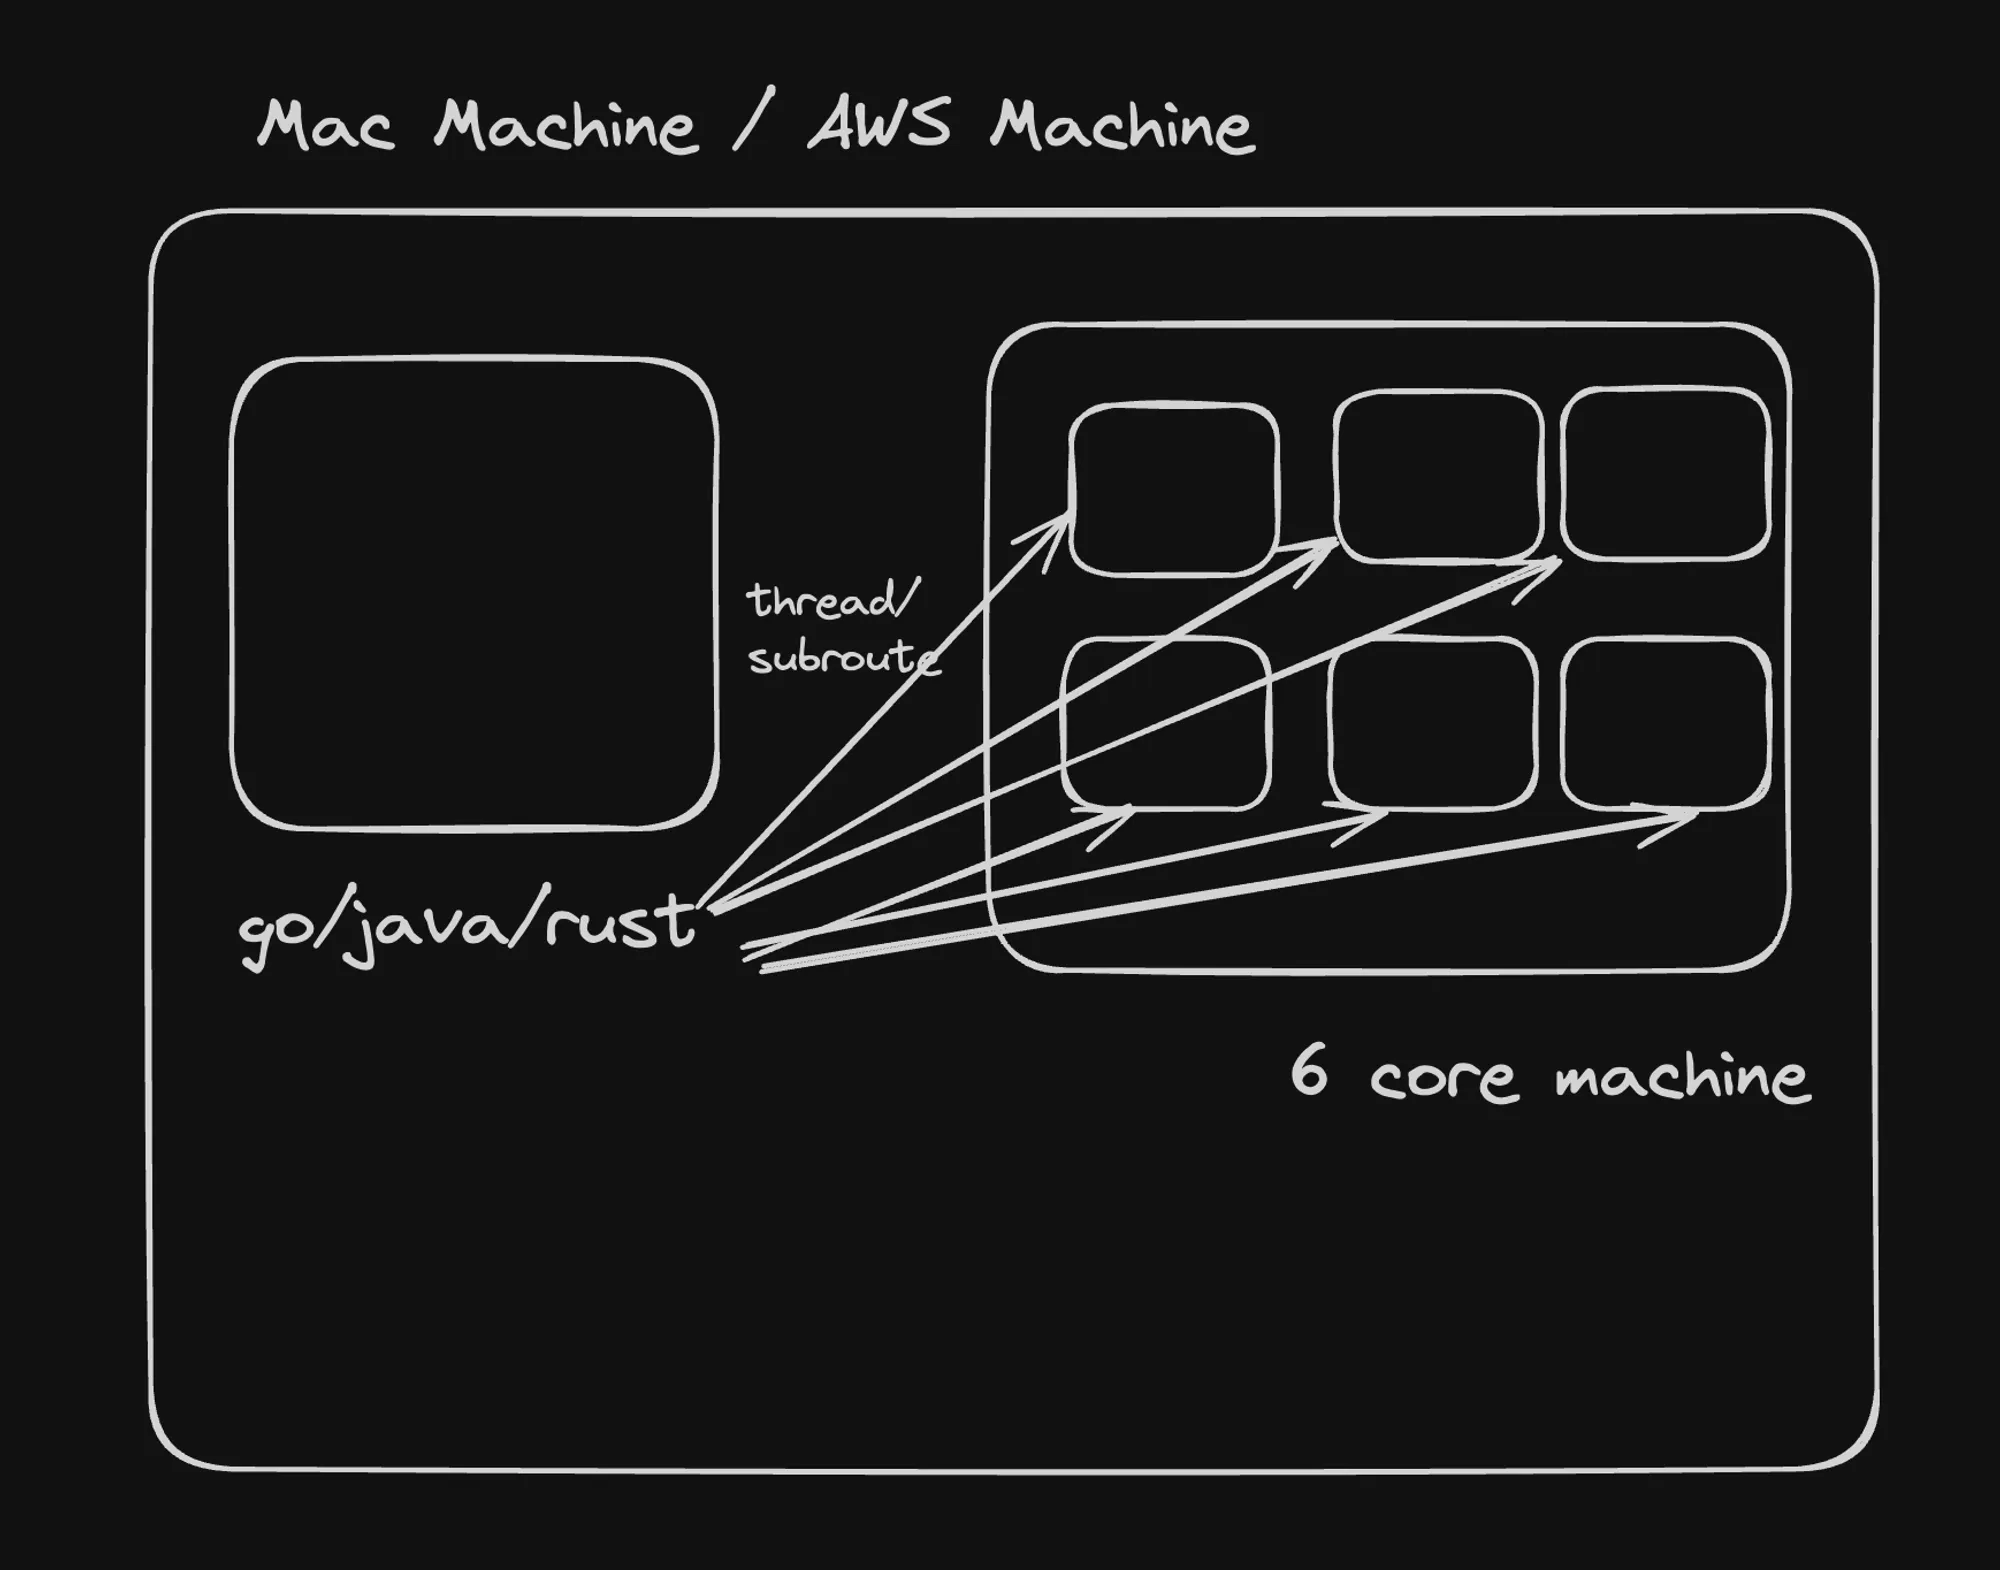
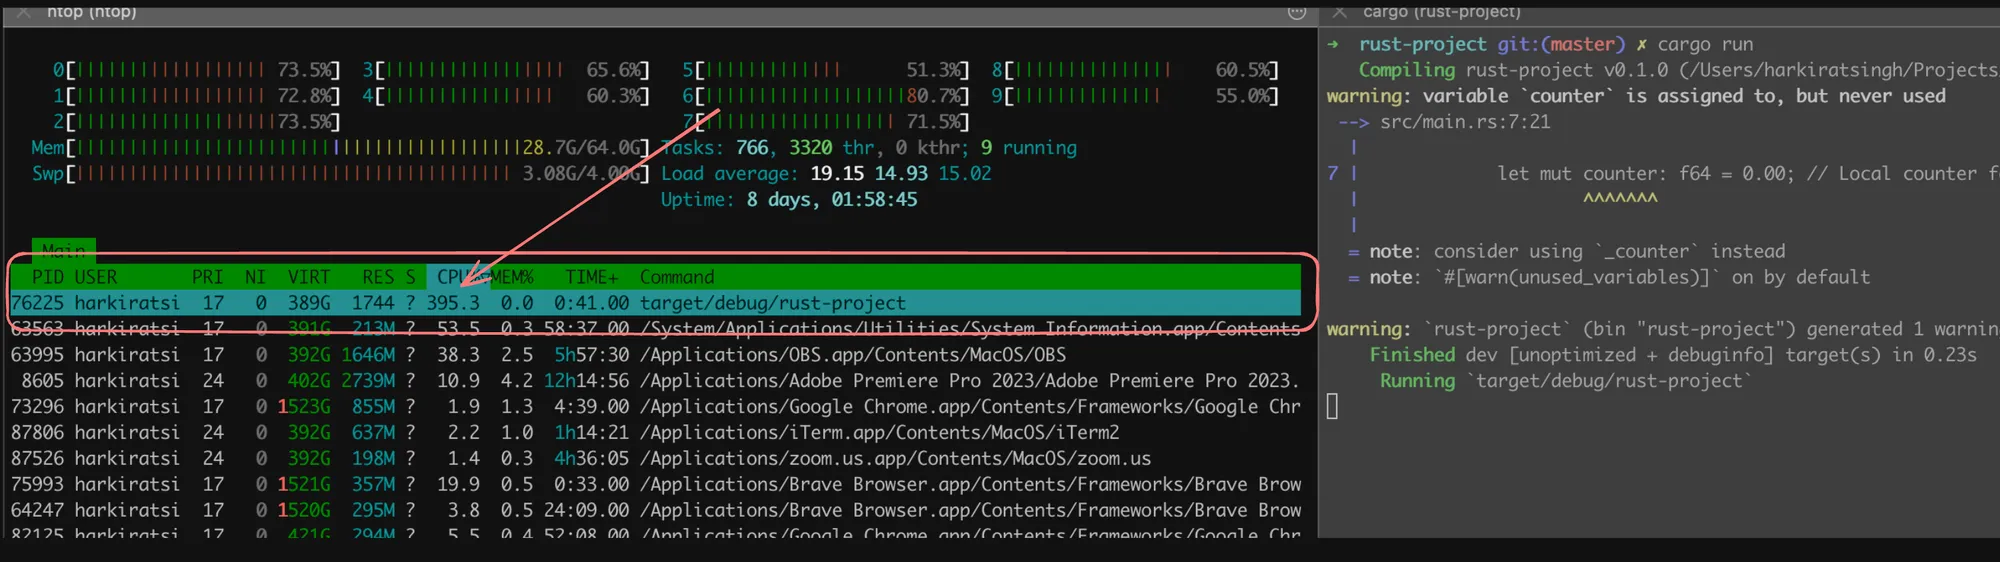
In Rust, you can create and manage threads using the std::thread module. Here’s an example that spawns three threads, each running an infinite loop:
use std::thread;
fn main() {    // Spawn three threads    for _ in 0..3 {        thread::spawn(|| {            let mut counter: f64 = 0.00;            loop {                counter += 0.001;            }        });    }
    loop {        // Main thread does nothing but keep the program alive    }}
In this example, three threads are created, each incrementing a floating-point counter in an infinite loop. The main thread simply runs an empty loop to keep the program alive. This code will utilize multiple CPU cores, with each thread consuming a portion of the available resources.
It’s important to note that while multi-threaded languages can leverage multiple CPU cores, they also introduce additional complexity in terms of thread synchronization, shared memory access, and potential race conditions. Proper synchronization mechanisms, such as mutexes or message passing, must be employed to ensure thread safety and avoid data corruption or undefined behavior.
In summary, vertical scaling involves increasing the hardware resources of a single machine, while the choice between single-threaded and multi-threaded languages depends on the specific requirements of the application and the need for parallel processing or leveraging multiple CPU cores.
Implementing Horizontal Scaling in Node.js Project
Node.js, being a single-threaded language, can benefit from horizontal scaling to take advantage of multiple CPU cores and distribute the workload across multiple processes. However, manually starting multiple Node.js processes can be cumbersome and prone to issues like port conflicts and process management. This is where the cluster module comes into play.
The cluster module in Node.js provides a way to create and manage multiple worker processes, allowing you to leverage all available CPU cores and distribute the workload across these processes.
Here’s an example of how to implement horizontal scaling using the cluster module in a Node.js project:
import express from "express";import cluster from "cluster";import os from "os";
const totalCPUs = os.cpus().length;const port = 3000;
if (cluster.isPrimary) {  console.log(`Number of CPUs is ${totalCPUs}`);  console.log(`Primary ${process.pid} is running`);
  // Fork workers.  for (let i = 0; i < totalCPUs; i++) {    cluster.fork();  }
  cluster.on("exit", (worker, code, signal) => {    console.log(`worker ${worker.process.pid} died`);    console.log("Let's fork another worker!");    cluster.fork();  });} else {  const app = express();  console.log(`Worker ${process.pid} started`);
  app.get("/", (req, res) => {    res.send("Hello World!");  });
  app.get("/api/:n", function (req, res) {    let n = parseInt(req.params.n);    let count = 0;
    if (n > 5000000000) n = 5000000000;
    for (let i = 0; i <= n; i++) {      count += i;    }
    res.send(`Final count is ${count} ${process.pid}`);  });
  app.listen(port, () => {    console.log(`App listening on port ${port}`);  });}
In this example, we first check if the current process is the primary process using cluster.isPrimary. If it is, we fork worker processes equal to the number of available CPU cores using cluster.fork(). We also set up an event listener for the exit event, which forks a new worker process if an existing worker dies.
If the current process is a worker process, we create an Express app and define routes for handling requests. In this example, we have two routes: one for returning a simple “Hello World!” message, and another for performing a CPU-intensive task (summing up numbers from 0 to a specified value).
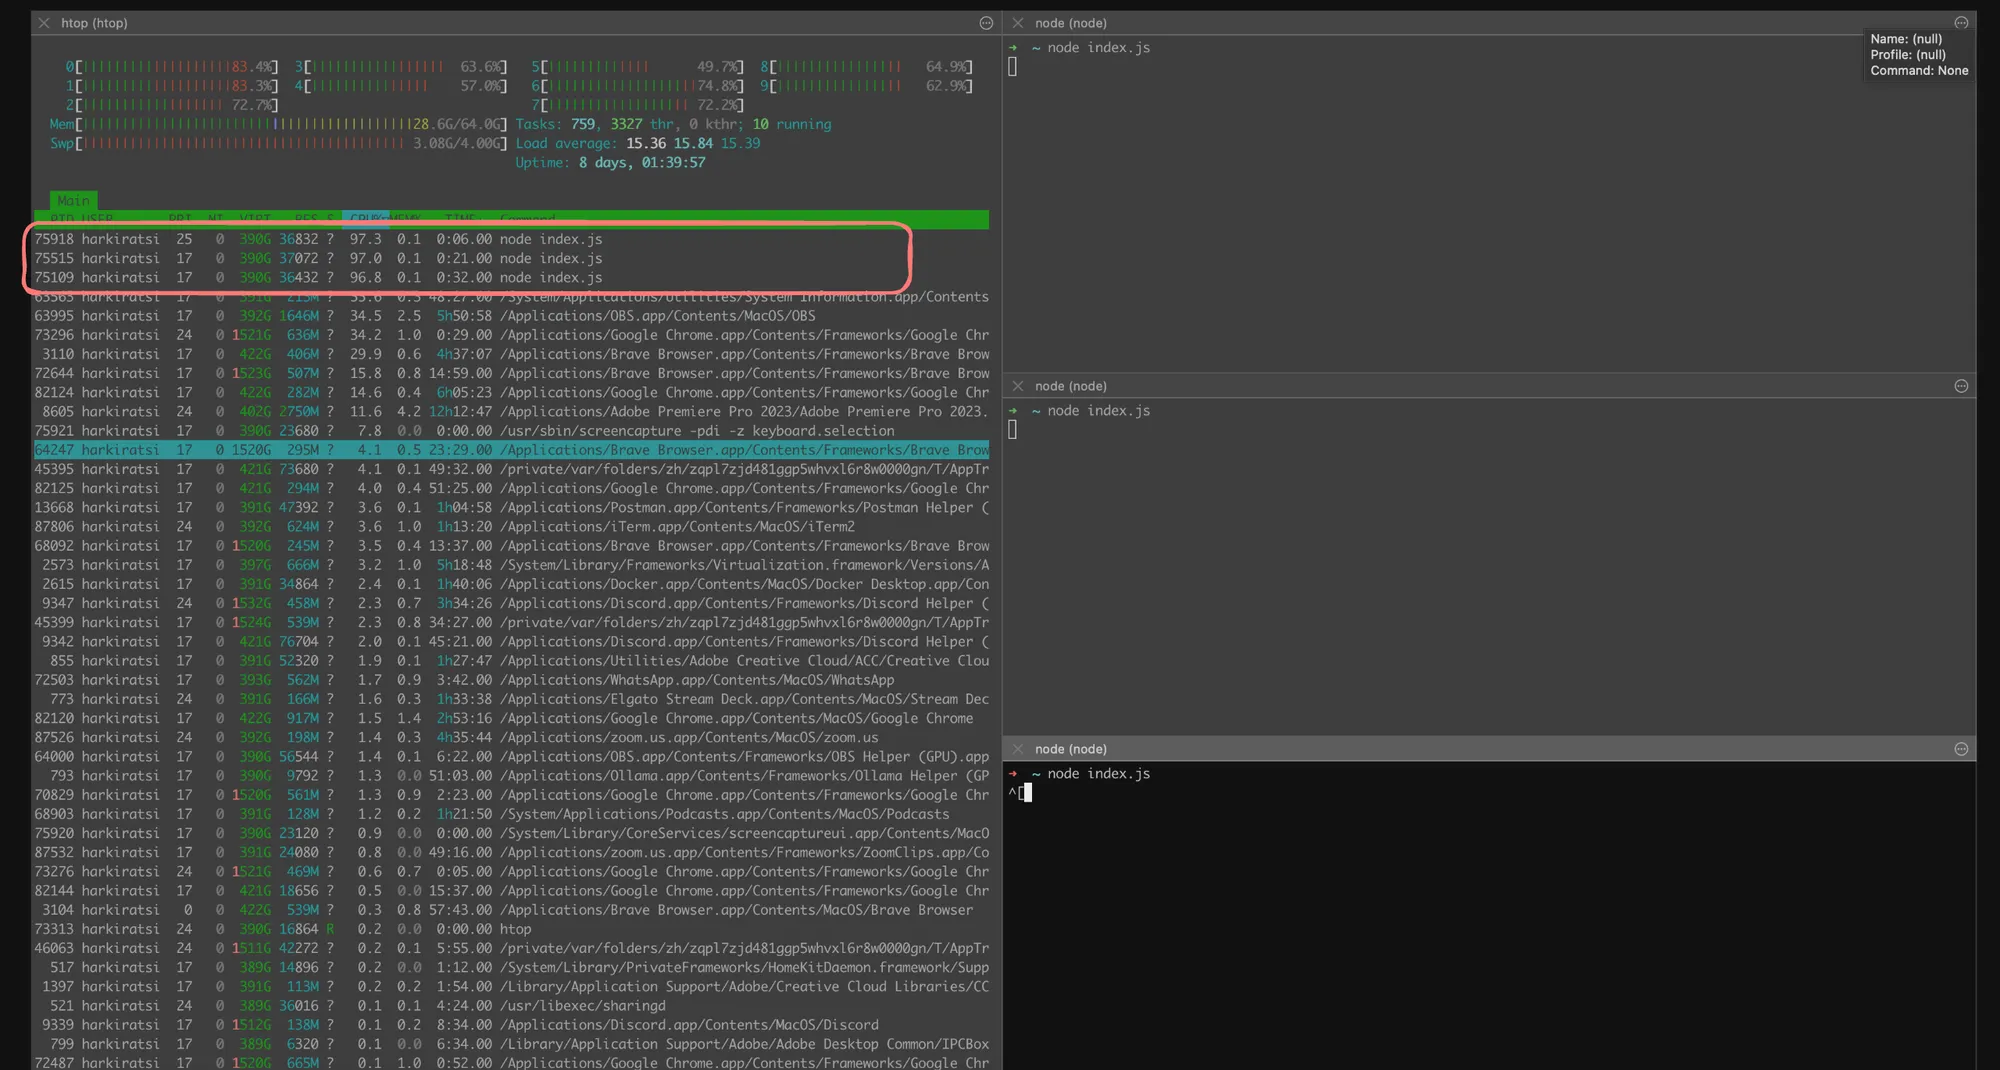
When you run this code, you’ll see output similar to the following:
Number of CPUs is 8Primary 12345 is runningWorker 67890 startedWorker 23456 startedWorker 78901 started...You can then send requests to the server using different tools like a web browser, Postman, or cURL, and you’ll notice that the requests are being handled by different worker processes, as indicated by the different process IDs (PIDs) in the response.
Stickiness in the Browser
You might notice that when sending requests from the same browser, the requests tend to be handled by the same worker process (stickiness). This behavior is due to the way browsers handle HTTP connections and keep them alive for subsequent requests to improve performance.
Browsers typically establish a persistent connection with the server and reuse it for subsequent requests to the same domain. This connection is associated with a specific worker process, leading to the observed stickiness.
To mitigate this behavior and distribute requests more evenly across worker processes, you can configure your server to use load balancing techniques or employ a reverse proxy server that manages the distribution of requests across multiple worker processes.
Capacity Estimation
Capacity estimation is a critical aspect of system design, especially when planning for scalability and reliability. In a system design interview, you may be asked how you would scale your server, handle traffic spikes, and support a certain Service Level Agreement (SLA) given specific traffic conditions. This section will elaborate on these points and explain the attached architecture diagrams in detail.
How Would You Scale Your Server?
Scaling a server involves increasing its capacity to handle more load. There are two primary methods of scaling:
- Vertical Scaling (Scaling Up): Increasing the resources (CPU, RAM, storage) of a single server. This approach is limited by the maximum capacity of the hardware.
- Horizontal Scaling (Scaling Out): Adding more servers to distribute the load. This approach is more flexible and can handle larger increases in traffic.
How Do You Handle Spikes?
Handling traffic spikes requires a dynamic approach to scaling. Here are some strategies:
- Auto Scaling: Automatically adding or removing servers based on the current load. This ensures that the system can handle sudden increases in traffic without manual intervention.
- Load Balancing: Distributing incoming requests across multiple servers to ensure no single server is overwhelmed.
- Caching: Storing frequently accessed data in a cache to reduce the load on the servers.
How Can You Support a Certain SLA Given Some Traffic?
Supporting a specific SLA (e.g., 99.9% uptime) requires careful planning and monitoring:
- Redundancy: Having multiple servers and data centers to ensure that if one fails, others can take over.
- Monitoring and Alerts: Continuously monitoring the system’s performance and setting up alerts for any issues.
- Capacity Planning: Estimating the required capacity based on current and projected traffic and ensuring that the system can handle it.
Paper Math for Capacity Estimation
Capacity estimation often involves some basic calculations:
- Estimating Requests per Second (RPS): Based on the number of users and their activity patterns.
- Determining Machine Capacity: Estimating how many requests a single machine can handle based on its specifications and the nature of the workload.
- Auto Scaling: Setting up rules to add or remove machines based on the load.
Example 1: PayTM App
For a payment app like PayTM, you need to handle a large number of transactions per second, especially during peak times like sales or festivals. The architecture might include:
- Auto Scaling Groups: To handle varying loads.
- Load Balancers: To distribute traffic.
- Database Sharding: To manage large volumes of transaction data.
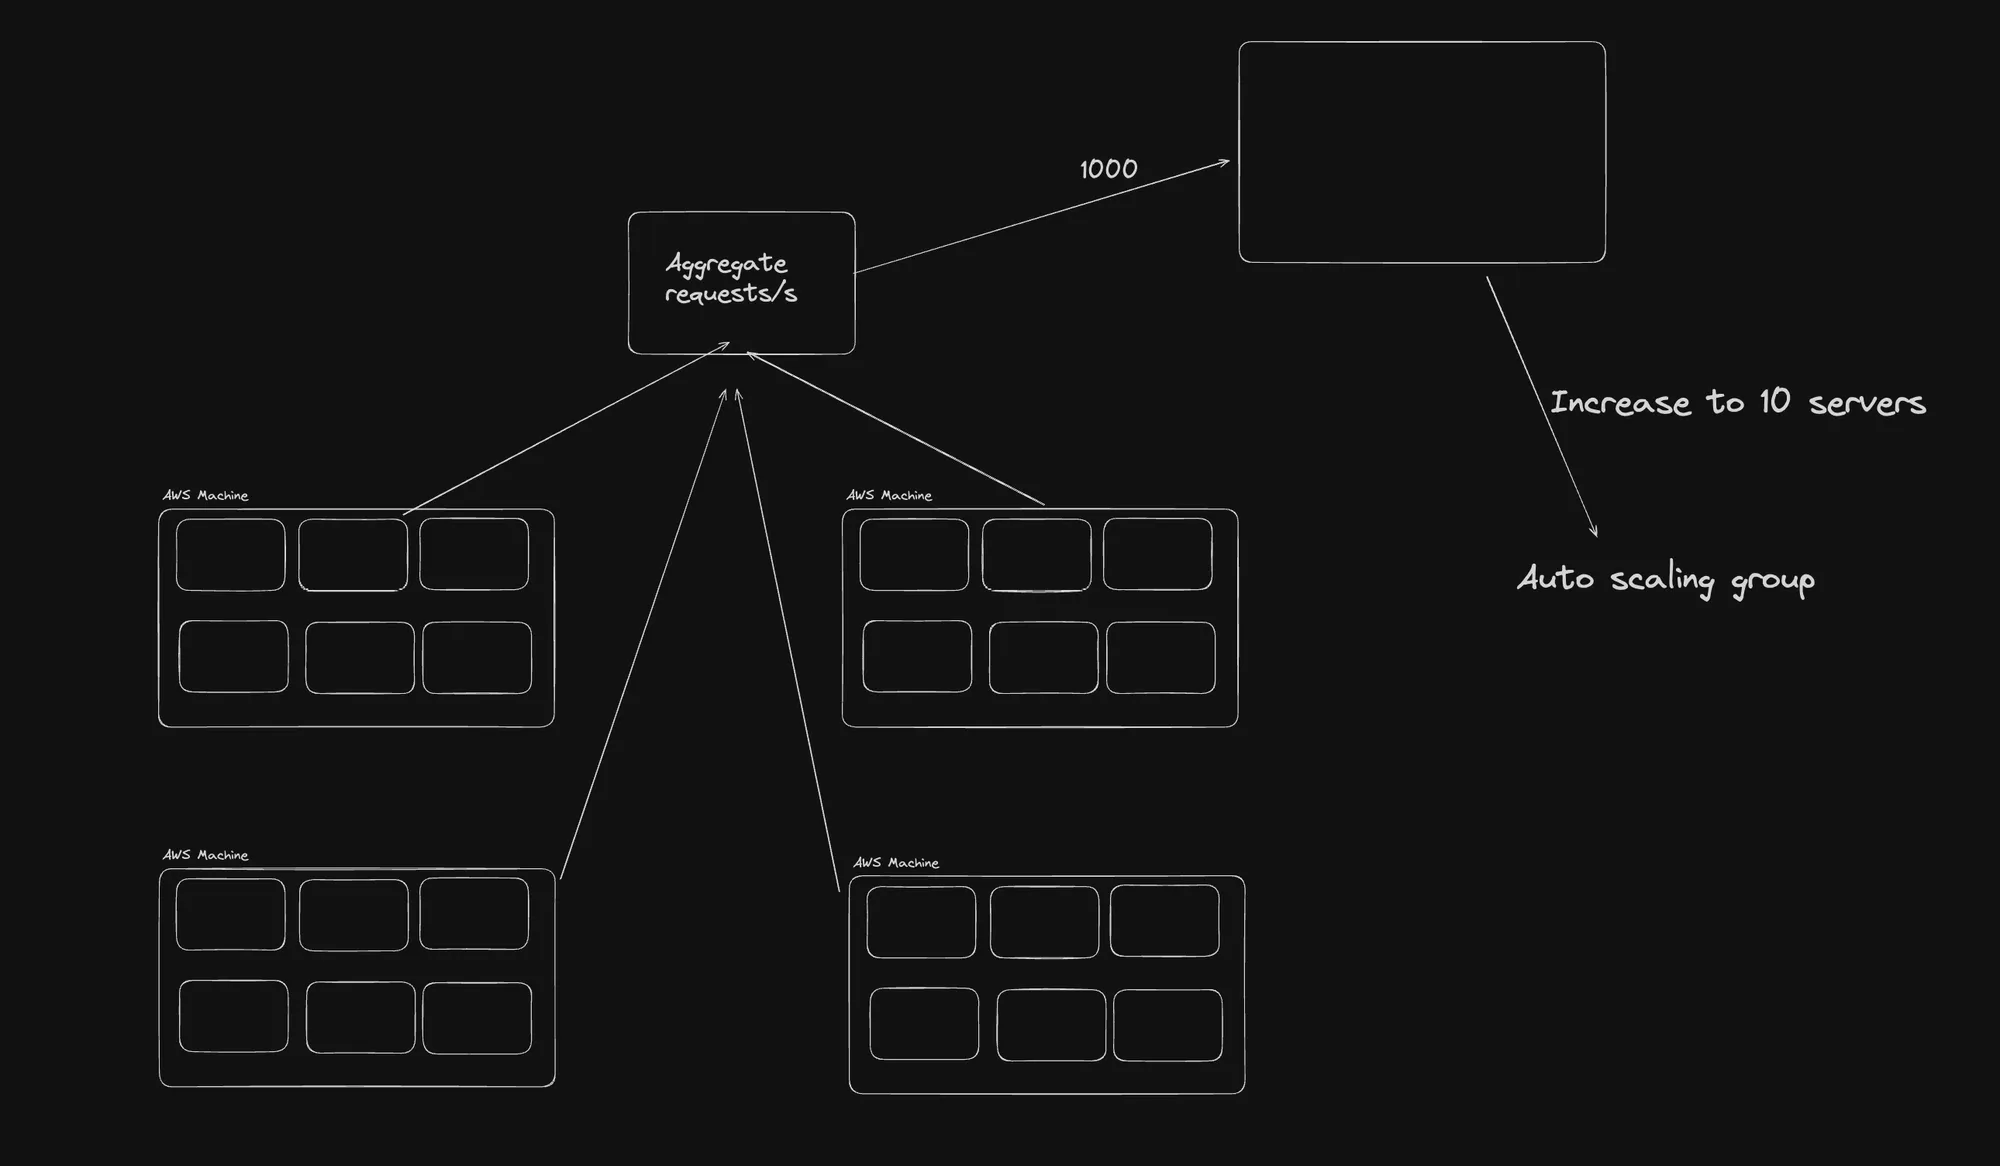
Aggregate Requests and Auto Scaling
This diagram shows a system designed to handle aggregate requests with auto-scaling capabilities:
- Aggregate Requests: The system aggregates incoming requests.
- Auto Scaling Groups: These groups dynamically scale the number of servers based on the load.
- Auto Machines: Individual processing units that handle the requests. The system can increase the number of these machines to handle higher loads, up to 10 servers
Example 2: Chess App
For a chess app, the focus might be on real-time interactions and maintaining game state. The architecture might include:
- WebSockets: For real-time communication.
- Auto Scaling: To handle peak times when many users are playing simultaneously.
- Persistent Connections: To maintain game state and player interactions.
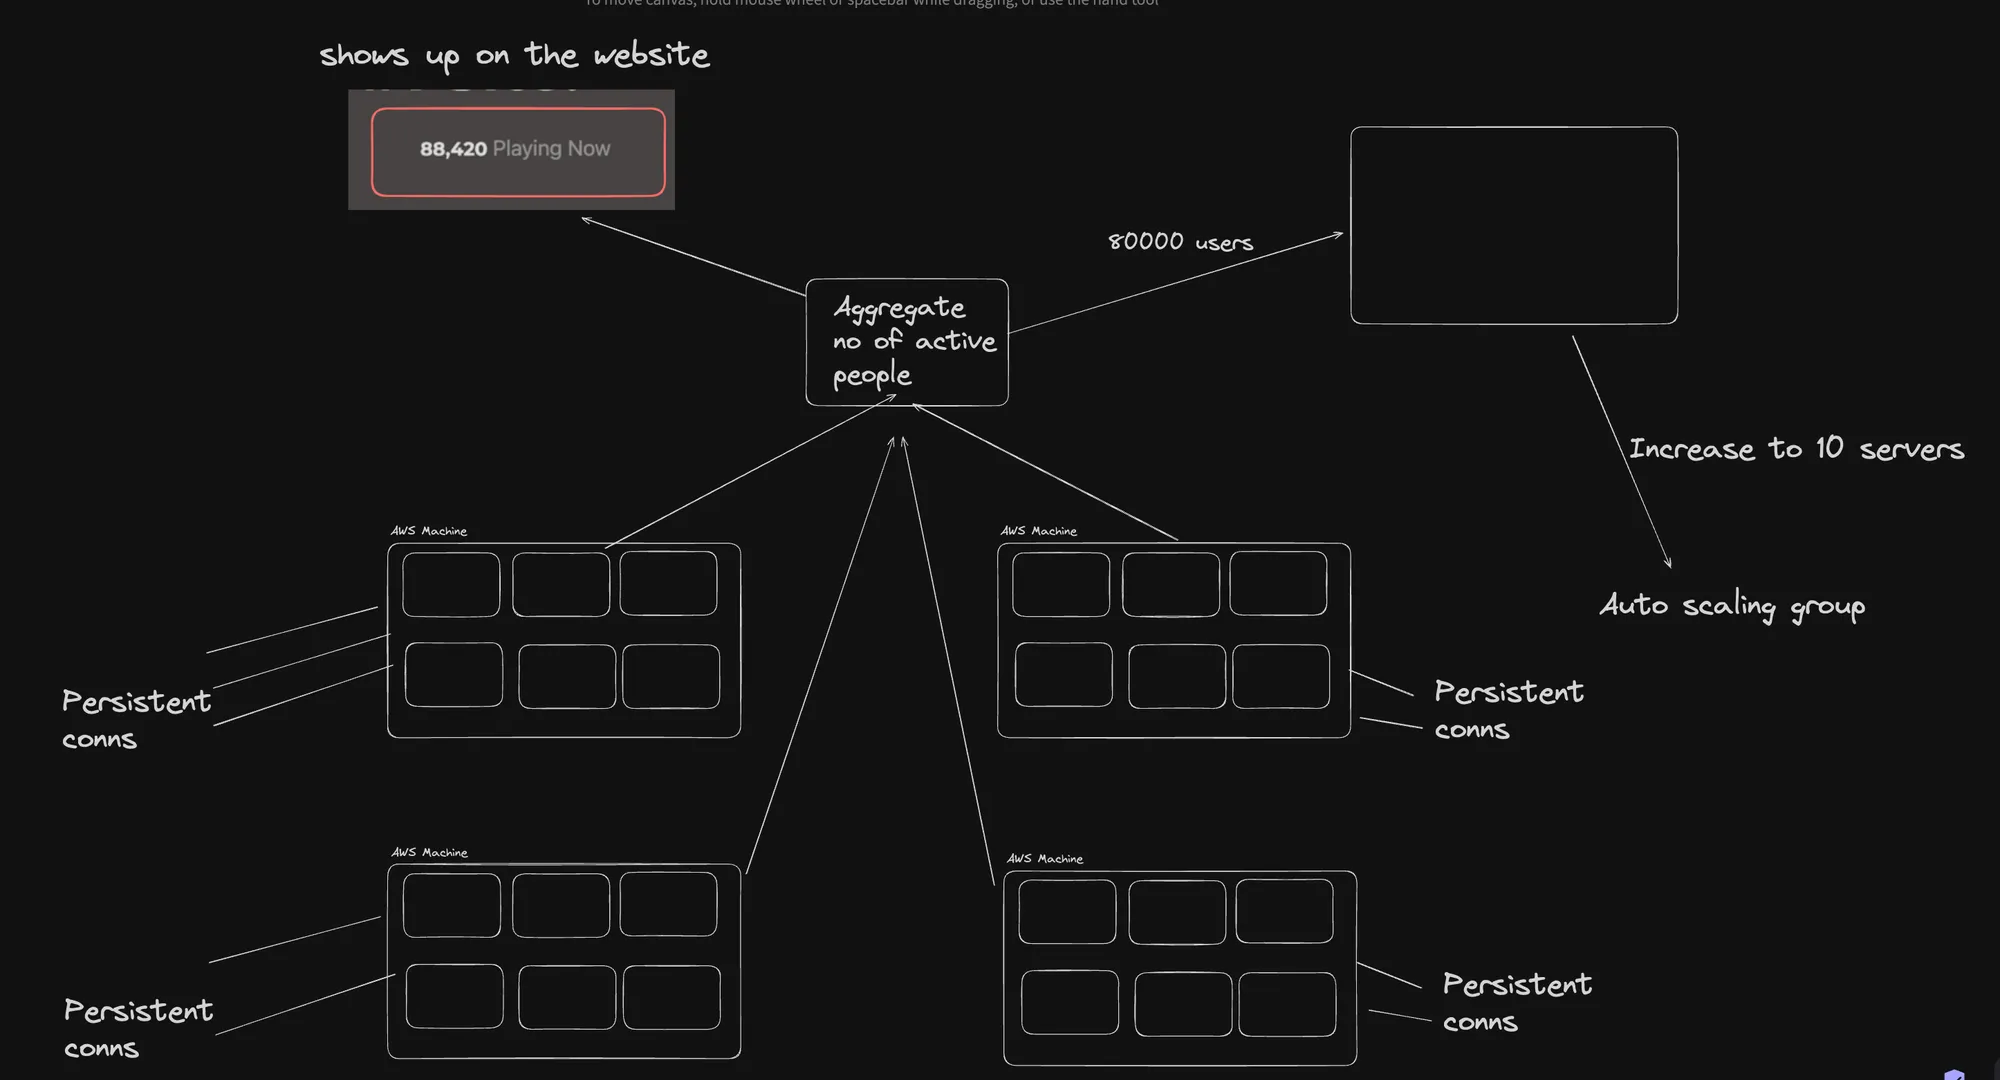
Aggregate Number of Active People
This diagram focuses on tracking the number of active users and scaling accordingly:
- Aggregate Number of Active People: The system tracks the number of active users, shown as 90,000 users.
- Persistent Connections: Each server maintains persistent connections with users.
- Auto Scaling Groups: The system can increase the number of servers to handle the load, up to 10 servers.
- Playing Now Metric: Shows the number of users currently active, e.g., 88,420.
Capacity estimation involves understanding the current and projected load, determining the capacity of individual machines, and setting up auto-scaling to handle varying traffic. By using techniques like load balancing, caching, and redundancy, you can ensure that your system meets its SLA and handles traffic spikes effectively. The provided diagrams illustrate how auto-scaling and persistent connections can be used to manage large numbers of requests and active users.